Problem 1 · 2021 Math Kangaroo
Medium
Spatial & Visual Reasoning
estimate-and-pick
Show answer
Answer: E
Show hints
Hint 1 of 2
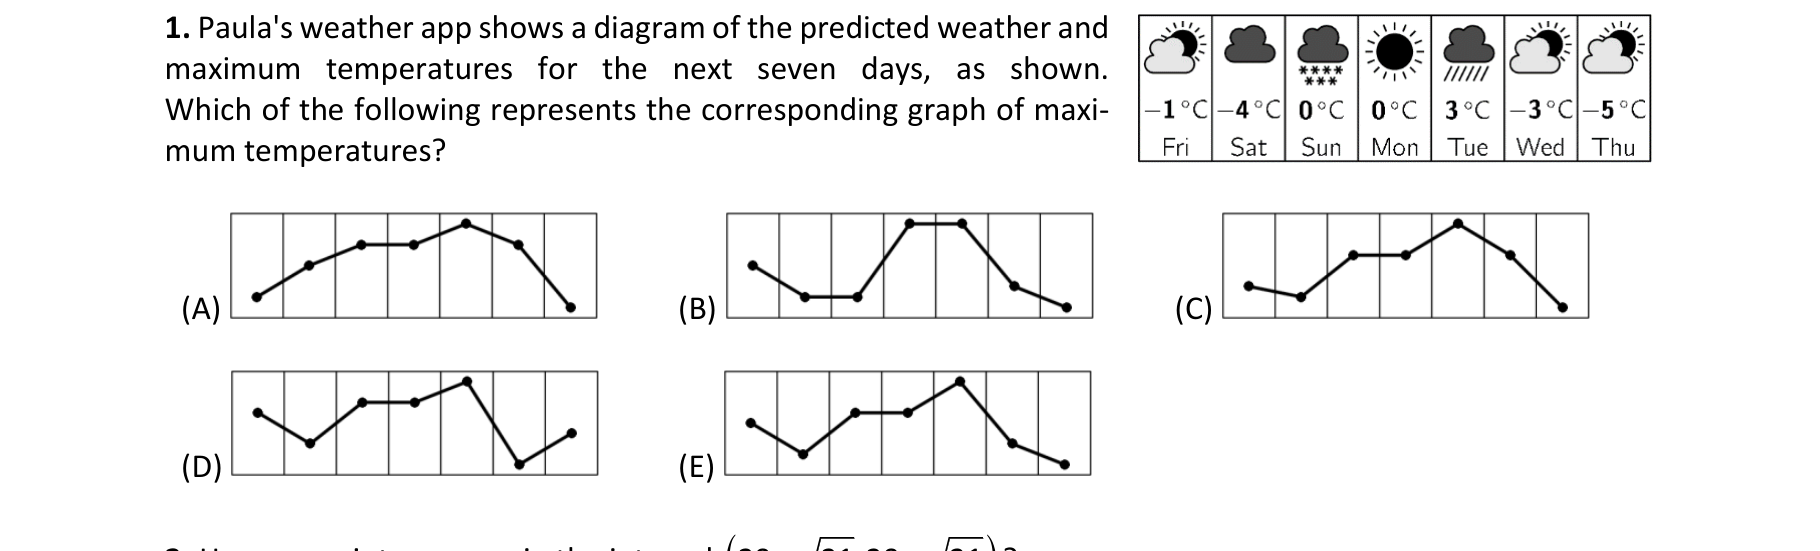
Read the seven temperatures off the table in order and picture their up-and-down shape.
Still stuck? Show hint 2 →
Hint 2 of 2
Match that exact sequence of rises and falls to one of the graphs, paying attention to where the single peak is.
Show solution
Approach: read the data and match the shape
- The maximum temperatures Fri–Thu are −1, −4, 0, 0, 3, −3, −5.
- So the values drop to a low on Saturday, climb to a peak on Tuesday (+3), then fall to the lowest value on Thursday.
- Only graph E shows that dip, rise to a single peak, then a steep drop to the end.
Mark:
· log in to save