Problem 2 · 2012 Math Kangaroo
Easy
Algebra & Patterns
estimate-and-pick
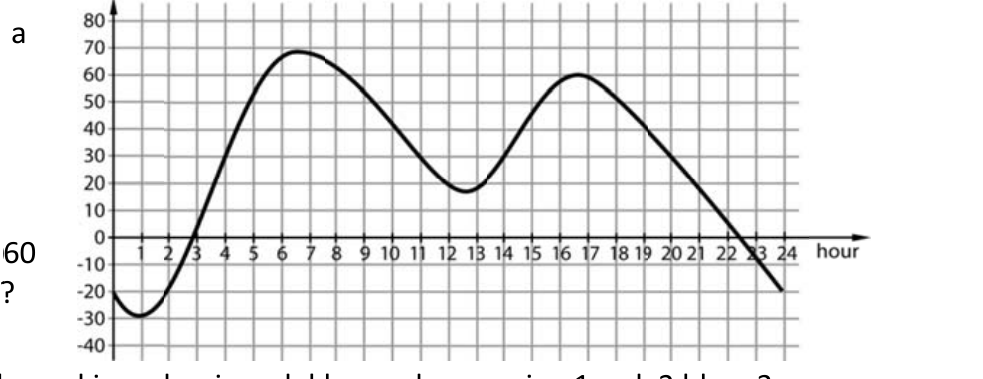
The water level in a port rises and falls on a certain day as shown in the diagram. How many hours on that day was the water level over 30 cm?
Show answer
Answer: E — 13
Show hints
Hint 1 of 2
Draw the horizontal line at height 30 across the graph.
Still stuck? Show hint 2 →
Hint 2 of 2
Add up the time intervals where the curve stays above that line.
Show solution
Approach: read the graph against the 30 cm line
- Mark the level 30 cm as a horizontal line on the diagram.
- Find where the curve is above that line and total those time spans.
- Those intervals add up to 13 hours.
Mark:
· log in to save