Problem 8 · 2018 AMC 8
Easy
Arithmetic & Operations
careful-counting
Show answer
Answer: C — 4.36.
Show hints
Hint 1 of 2
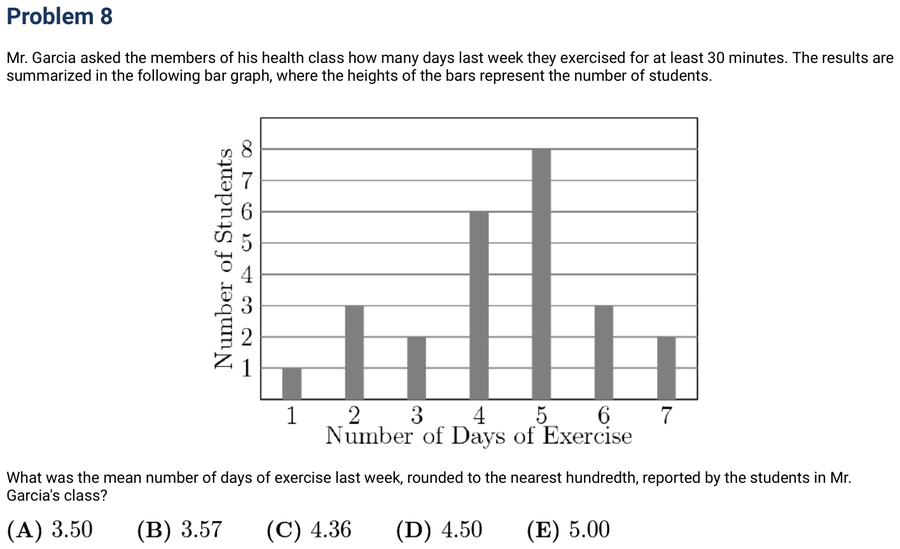
The big trap: those bars are not seven numbers to average. Each bar's height is how many students reported that many days — so a tall bar should count much more heavily than a short one.
Still stuck? Show hint 2 →
Hint 2 of 2
The technique is a weighted average: total up (day-value × how many students), then divide by the total number of students — never just average the labels 1 through 7.
Show solution
Approach: weighted mean from the bar heights
- Read the bar heights as student counts for 1 through 7 days: 1, 3, 2, 6, 8, 3, 2. Add them: 1+3+2+6+8+3+2 = 25 students total.
- Total exercise-days = (days × students), summed: 1·1 + 2·3 + 3·2 + 4·6 + 5·8 + 6·3 + 7·2 = 1 + 6 + 6 + 24 + 40 + 18 + 14 = 109.
- Mean = 109 ÷ 25 = 4.36. Sanity check: the data piles up around 4–5 days, so an average near 4.4 fits — and the naive (wrong) average of 1–7 would be 4.00, which isn't even an option.
- You'll see it again: any "mean from a frequency table or bar graph" is a weighted average — sum of (value × frequency) over total frequency.
Mark:
· log in to save