Problem 19 · 1989 AJHSME
Hard
Ratios, Rates & Proportions
read-cumulative-graphdifferences
Show answer
Answer: B — 2.5.
Show hints
Hint 1 of 3
Read carefully: the graph shows TOTAL accumulated dollars, a running tally that only climbs. The height at any month is everything spent up to then — not the spending of that month alone.
Still stuck? Show hint 2 →
Hint 2 of 3
On a running-total graph, the spending during a stretch of time is how much the curve RISES across that stretch (end value minus start value), not the height itself.
Still stuck? Show hint 3 →
Hint 3 of 3
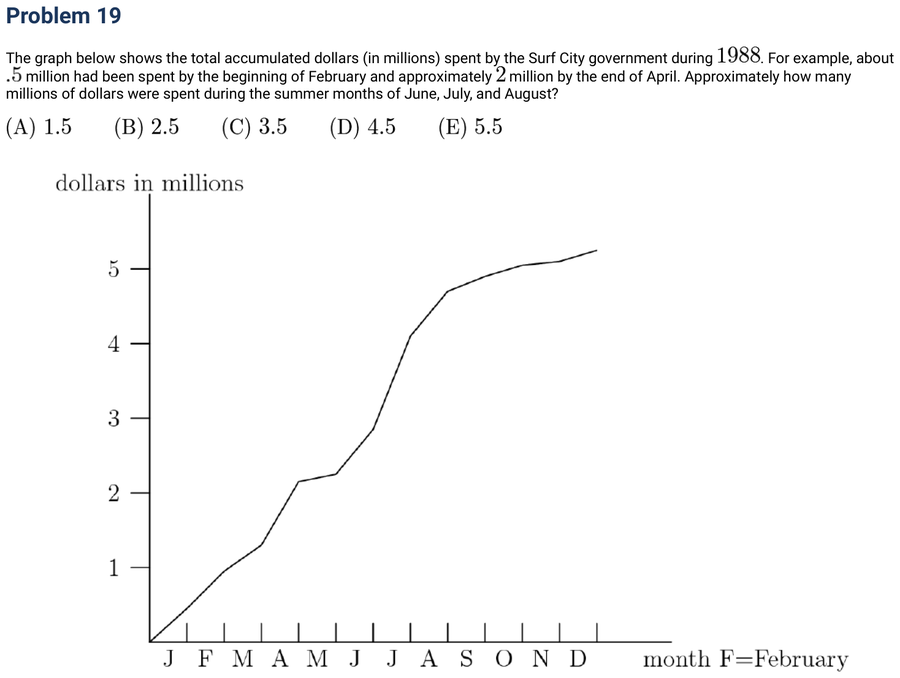
Summer is June, July, August — so it starts at the end of May and finishes at the end of August. Read the curve's height at both moments and subtract.
Show solution
Approach: rise of the running total across the window
- The key is the word 'accumulated' — the curve is a running total that never goes down, so each month's height already includes all earlier months. To isolate the summer, take the rise of the curve from where summer begins to where it ends.
- Summer = June + July + August, which spans from end-of-May to end-of-August. Read the curve: ≈ 2.2 million at end-of-May, ≈ 4.7 million at end-of-August.
- Summer spending ≈ 4.7 − 2.2 = 2.5 million.
- Trap to avoid: don't read 4.7 (the end-of-summer total) as the summer's spending — that would count the whole first half of the year too. On any cumulative graph, a period's amount is always a difference of two heights.
Mark:
· log in to save