Problem 11 · 1992 AJHSME
Medium
Fractions, Decimals & Percents
read-graphpercent
Show answer
Answer: B — 24%.
Show hints
Hint 1 of 3
"What percent preferred blue" is blue out of EVERYONE — not blue out of the tallest bar. What's the denominator you actually need?
Still stuck? Show hint 2 →
Hint 2 of 3
A percent always needs its whole: percent = part ÷ total. Here the total is every bar added together, so read them all before dividing.
Still stuck? Show hint 3 →
Hint 3 of 3
Line up the bar tops with the frequency scale carefully — each gridline is worth 20.
Show solution
Approach: blue's count divided by the grand total of all bars
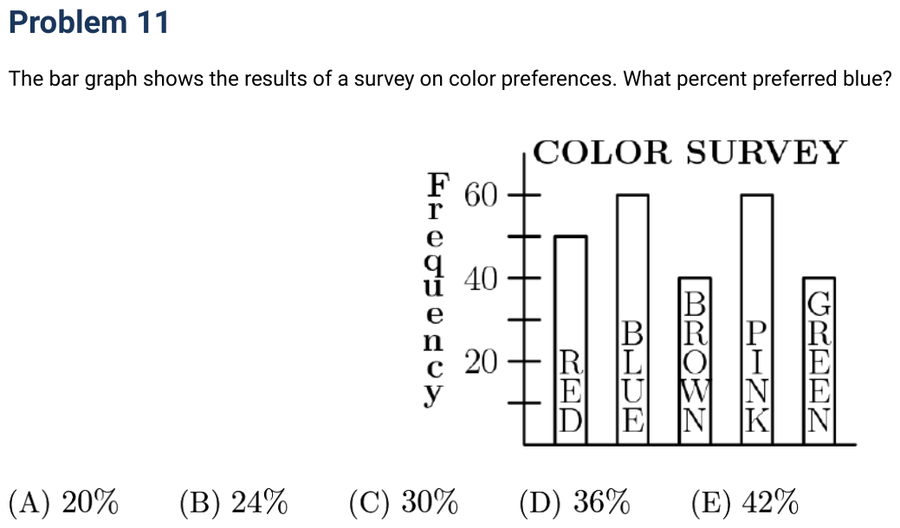
- Read each bar against the scale: Red 50, Blue 60, Brown 40, Pink 60, Green 40. The total surveyed is 50 + 60 + 40 + 60 + 40 = 250.
- Blue's share is 60 out of 250: 60 ÷ 250 = 0.24 = 24%.
- Why this transfers: the most common percent-from-a-graph mistake is forgetting to total ALL the bars — the part means nothing without its whole. Always build the denominator first.
- Sanity check: blue is one of five bars, so a fair share would be 20%. Blue is a little above average height, so a little above 20% — 24% fits.
Mark:
· log in to save